The impact of recent Department of Energy pauses on export permits on the current and planned facilities for LNG exports
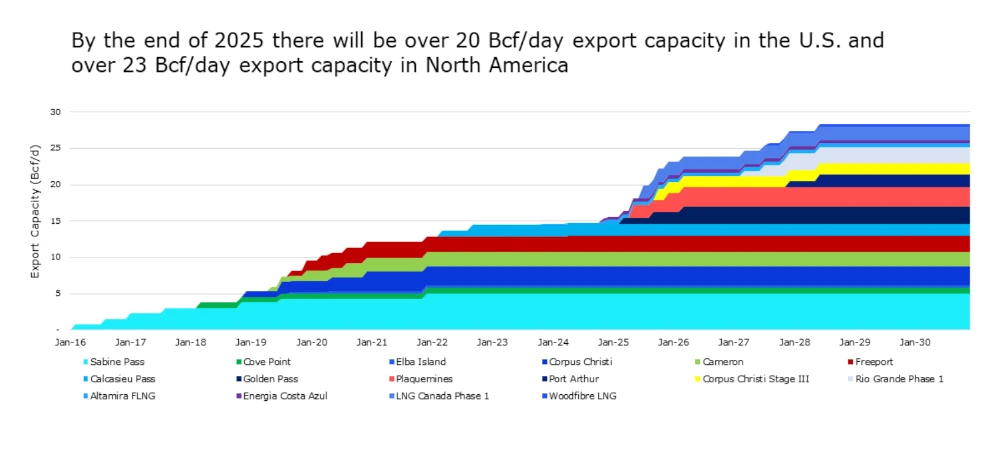
The recent DOE pause could impact projects past mid-2028. The near-term project queue, which is set to add 10.6 Bcf/day of capacity, is unaffected since these projects have already been approved and have the permits under review.
The impact of the Mountain Valley Pipeline to be completed this year
Following the volatility of 2022, basis pricing has been moving in a favorable direction both for the near-term and further out on the curve for the Northeastern markets. Some of the price movement was in response to the loosening of supply/demand coming off a mild 2023. However, since the permits for MVP were expedited, basis is trading significantly lower (over the past year and a half in particular) and, in most cases, is backwardated through 2028. With the expected growth of gas demand from power burn generation and export capacity, it may make sense to lock in that basis value longer term and create a layered approach for your natural gas purchases.
With demand response values down, is DR worth it?
DR values are primarily driven by capacity prices. Although the PJM enrollment season is closing, it’s worth noting that it is the biggest DR market. PJM DR values are quite low historically, but the next capacity auction results are expected this summer, which could have an impact. DR values in other markets, like New York (especially downstate) and New England, are quite strong (as high as $300k/MW in New York City when participating in both the utility and ISO programs). But it really comes down to the ability and willingness of an organization to curtail load for economic benefit.
A Strategic Load Management service could help you prepare for demand response. It could also help with strategies for reducing on peak load days to help lower your capacity and transmission obligations (i.e. “tags”) and thus your cap and trans costs.
Another option to consider that works with or without participation in DR is NRG’s proprietary Responsive Economic Dispatch (RED) program. This program has no penalties but provides an opportunity for you to earn for what you can curtail.
Always sign fixed price contracts but consider other alternatives based on the current index discount.
If you think about your investment strategy, it’s not really about putting all your money into one financial instrument. The same applies to your investment in electricity and energy. It could benefit you to diversify, especially in a dynamic price market. Concern about switching away from the familiarity and simplicity of a fixed price product is not uncommon. However, you have choices in how you manage your exposure to index pricing when you’re not on a straight fixed price plan that allow you to hedge against rising prices, while capitalizing on low pricing or dips as they occur.
A Load Following Block & Index (or LFBI) product offers the ability to layer energy hedges in percentages of your load—including the ability to execute one or multiple hedges to cover 100% of your requirements and eliminate index exposure. With this product structure, if market prices fall such that the index is no longer attractive, you can fix 100% of your load. We like to call this “enhanced fixed price” by achieving your fixed price in layers, with the option to participate in the index market
The El Niño Southern Oscillation (ENSO) region is currently experiencing lingering warm anomalies across the equator, but cooler-than-normal sea surface temperatures (SSTs) across the eastern Pacific. Positive ENSO anomalies are associated with El Niño and negative anomalies are associated with La Niña.
El Niño peaked back in December and has been slowly weakening through early this year. Current forecasts show a more rapid descent toward neutral through spring, then to La Niña by summer. The NOAA ENSO Probabilities indicates a medium chance (50-60%) of having La Niña conditions for early summer and higher chances later in the summer and into the fall.
Summer Weather Outlook
Since the year 2000, summers on average have increased by 6.7 population-weighted cooling degree days (PWCDDs)/year. Degree days are the difference between the daily temperature mean and 65°. While last summer ran hot across Texas, nationally it was under the 2000s trend. The top 10 warmest summers (from 1950 to present) have occurred since 2010, with last summer sliding in as the 10th hottest on record and 2022 as the hottest.
What does a summer La Niña imply? La Niña conditions typically indicate dryer/warmer summer weather.
Winter Power, Gas & Electricity Review
With another above-normal winter, the warmest on record for Dec.-Jan.-Feb. dating back to 1950, the natural gas market is over-supplied. Except for the short-lived January freezing temps, which prompted some volatility, index prices remained stable/low.
We exited winter with gas storage at a significant surplus to the 5-year average, finishing withdrawal season (March) at 2,275 Bcf. Natural gas exports hit a new record of 15.1 Bcf/day (in December) but then dipped in January following the cold weather and maintenance issues at Freeport. NYMEX remained low during December and February and only showed short-lived volatility in January in response to Winter Storm Heather.
Power burn demand set a new record in January and flirted with record 2023 levels for Feb/March. This may continue as we head into nuclear maintenance season if low index pricing continues.
Market Fundamentals of Natural Gas in 2024
Two warm winters ending in storage surpluses have resulted in sustained low prices, including sub-$2/MMBtu this spring. However, the supply/demand balance may be changing. Producers are starting to respond to low prices, with a forecasted 1.5 Bcf/day drop in production this summer over last, recently pushing below 100 Bcf/day which could continue for most of the summer.
Decreased production with increasing power burn demand (coal-to-gas switching) and LNG exports are bullish factors for prices. A hot summer would further increase demand for power burn. Pipeline infrastructure updates will help deliver supplies from key production sites to regions like the East Coast/Mid-Atlantic and Southeast, while regions like the Midwest may see a bullish impact to basis with gas now flowing to other regions.
Near-term pricing remains low compared to historicals, with upside risk outweighing downside opportunity, according to EIA confidence levels.
Buying Strategies
Buying in the shoulder months (spring or fall) might sound like the right thing to do—shoulder months don’t typically have the high demand or extreme weather that can cause price volatility. However, data indicates there’s no trend of consistent buying opportunities in Q2, as prompt month natural gas futures have risen in 4 of last 7 seasons. In 5 of last 7 seasons, the low price point has come between Christmas and end of March, with zero low points during Q2.
Buying in a contango natural gas market because near-term prices have declined—consistently—but long-term prices are higher than near-term and have had modest movement.
Near-term: “Waiting” has worked for the near-term, as buyers have reaped the benefits of the near-term price decline.
Long-term: While long-term prices are higherthan near-term, based on bullish fundamentals, those longer-term prices could rise and therefore today’s prices may be a value. Bullish fundamentals, like increased LNG exports and producer cuts, also make it less likely that longer-term prices will fall.
Regional basis considerations: basis is weak in the east, so a potential strategy in a contango market could include the NYMEX Plus product. You could lock in a longer-term basis then immediately trigger higher percentages for the lower-priced near-term, with a more gradual triggering strategy for the longer-term portion of your contract.
Regional Influences
ERCOT
Demand in Texas is growing much faster than elsewhere in the country and supply from dispatchable resources isn’t keeping up. As a result, net load has become more expensive to serve.
Forward prices for this summer are at or near all-time highs and are disconnected from NYMEX with modest backwardation.
Summer prices beyond this year have recently strengthened significantly given the potential future load growth from residential, AI, crypto, LNG projects, and hydrogen facilities.
When compared to forward prices ($50-60/MWh), the index for most hours of the day has shown value ($20-30/MWh), making forward purchases seem unattractive. But, certain hours on certain days can be in the thousands—which can blow up your index strategy and forward prices—so there may be value in some level of hedging (portions of your load) to protect yourself from extreme volatility and increases in longer-term prices.
Northeast
NYISO Zone J (and PJM as well to some extent) was seeing a downward trend in prices between last summer and this summer, until March-April 2024, when there’s been a sudden jump in long-term prices (’27-’28). This is due to the market being concerned about AI-driven data center load that is increasing across the east. The market is now in a steeper contango.
Near-term is showing the best value. Long-term (2026-2028 moving up), there is time to wait or consider a partial commitment with a lower percent forward hedge.
Non-energy Cost Components
PJM Cap & Trans Costs
Transmission costs are significantly higher than capacity behind most PJM utilities and, when combined with transmission, the two components can comprise 15-40% of your supply price. The next base residual capacity auction scheduled for July will be for the 2025-26 delivery year. Long-term, cap and trans fundamentals are bullish due to the increased reliance in this region on non-dispatchable generation assets and ongoing retirements of dispatchable resources.
NYISO Capacity Costs
Capacity prices are very strong, with in-city capacity up 3.6x in the last 12 months. Capacity costs now comprise 20-35% of supply costs in NYC and 10-15% for rest of state. These increases can be attributed to power exports to Canada and peaker plant retirements.
Strategies to Manage Demand
Consider cap and trans pass-through products with a peak load management program or demand response. Curtailing your load even for a few key hours during the peak load periods could result in savings.
Overall Considerations
Price trends have been favorable overall to start 2024, but procurement decisions remain difficult due to market inconsistencies and bullish longer-term pressures—including the impact of renewable generation comprising a larger chunk of the regional generation stack. A flexible strategy during times of uncertainty could help you better weather the storm through layered purchases for portions of your load requirements for various timeframes. And, if you’re located in PJM, NYISO or ERCOT, you may want to give serious consideration to load management services.
The U.S. Energy Information Administration says in the December Short-Term Energy Outlook that U.S. wholesale electricity prices will be higher and more volatile this winter – from 31% higher than last winter in Texas.
Highlights from the December Short-Term Energy Outlook:
In 2023, U.S. natural gas production is expected to rise to an average of more than 100 billion cubic feet per day for the first time. Pipeline constraints have limited production growth in the Permian Basin of Texas and New Mexico, but the constraints are expected to be resolved more quickly than previously projected.
Crude oil production in Venezuela is expected to rise slightly in the second half of 2023 after the United States ruled that Chevron can resume production there. DeCarolis noted uncertainty in the production forecast for Venezuela but expected production to rise “somewhat next year.”
Electricity generation from wind and solar power in Texas is expected to grow in 2023. Wind power is expected to account for 29% of the state’s electricity generation in 2023, up from 25% in 2022. The share of electricity generation from solar is projected to rise to 8% in 2023, from 5% in 2022. “Renewable sources will play a key role in meeting electricity demand in Texas during peak daytime hours,” DeCarolis said.
It is expected that electricity customers in Texas will pay more for electricity, but retail electricity prices are not expected to increase as much as wholesale prices this winter. The reason is that regulatory and contractual factors vary widely across the United States. During the core winter months – December through February – EIA is forecastes residential electricity prices to average $.145/kWh, which is 6% higher than last winter.
GET THE BEST ELECTRICTY FOR YOUR BUSINESS
We FORCE electricity companies to compete! Electricity providers will offer a lower price to us because they know they are competing for the business. This drives your price down!
The natural gas price at Henry Hub in 2021 averaged $3.91 per million British thermal units, with the 2022 price expected to average $6.48 per million Btu and $5.43 in 2023. In November Henry Hub averaged about $5.50 per million Btu; EIA said it is forecasting a spot price of more than $6 in the first quarter of 2023, with natural gas prices expected to increase from November levels due to higher winter natural gas demand and increasing LNG exports.
The National Oceanic and Atmospheric Administration is forecasting colder weather than last winter from October through March, with 7% more heating degree days than last winter and 2% more than the 10-year average.
EIA said it expects natural gas prices to begin to decline after January as storage levels move closer to a 5-year average but mostly a result of rising U.S. natural gas production.
The agency has raised its forecast for U.S. natural gas production by almost 1% for next year compared to its November forecast. EIA said it has expected natural gas production from the Permian basin to be limited early next year by lack of pipeline capacity but now expects those constraints to be resolved earlier than previously thought.
U.S. natural gas production is forecast to average 98.1 billion cubic feet per day this year, and in November EIA forecast an average of 99.7 bcf per day for next year, a forecast it has now raised to 100.4 bcf per day.
Production of more than 100 bcf per day in October and November exceeded pre-pandemic monthly records from 2019, EIA said, with growth in natural gas production driven by increased drilling activity in the Haynesville region in Louisiana and East Texas and in the Permian region in West Texas and Southeast New Mexico. “Recent pipeline infrastructure expansions in both these regions facilitated the increases in production,” EIA said.
The agency said forecast production in the first half of 2023 is limited by pipeline constraints and declining prices, with more pipeline infrastructure expansion projects scheduled to come online in the second half of the year, contributing to increases in dry natural gas production. “The pace at which these projects are completed is a notable uncertainty in our forecast, and delays could result in lower production than we expect,” EIA said.
LNG TRADE
U.S. natural gas exports are forecast to increase in 2023, “driven largely by growth in LNG exports,” EIA said. Those exports peaked in the first half of 2022 with facilities operating close to maximum capacity and the Calcasieu Pass facility coming online.
A June fire at Freeport LNG, however, removed some 2 billion cubic feet per day of U.S. LNG export capacity. Freeport has announced it plans to come back online in December and increase output to some 2 bcf per day in January.
Once Freeport is back online, EIA said it is forecasting that LNG exports will set a new record, close to 12.5 bcf per day, in March, with U.S. LNG exports expected to reach 12.7 bcf per day by the end of 2023.
No new U.S. LNG facilities are scheduled to come online in 2023, EIA said, and it is forecasting LNG exports in 2023 to average 12.3 bcf per day as facilities continue to operate close to maximum capacity to meet high demand for natural gas in Europe and Asia.
The U.S. also exports natural gas by pipeline to Canada and Mexico and those exports reached almost 9 bcf per day in November, EIA said, near a previous record. During the coming winter months pipeline exports are expected to be between 9 bcf and 10 bcf a day, reaching new record highs.
CRIUDE OIL PRICES IMPACT
EIA said Brent averaged $91 per barrel in November, up from an average of $70.89 per barrel in 2021. The agency is forecasting a 2022 average of $101.48 per barrel and $92.36 per barrel in 2023.
In November Brent reach almost $100 per barrel on Nov. 7, dropping by the end of the month to $86 per barrel. “The price declines were largely the result of market concerns about global economic growth, as well as COVID-related lockdowns in China that have reduced China’s oil demand,” EIA said, adding that despite the recent drop in prices, it expects Brent to be pushed back above $90 per barrel by the beginning of the second quarter on falling global inventories.
EIA said because global petroleum inventories are relatively low and it takes time to rebuild those inventories, the market has limited slack during the forecast period, and any unplanned supply disruption has the potential to increase oil prices quickly and significantly.
Wizard Energy puts the electricity market in context with real-time information
In Texas, Electricity rates don’t doesn’t exist in a vacuum outside of the whole energy market. To find the right electricity plan for your business (current and future needs), you need to know what is going on in the energy market now and how it will likely trend in the future.
Electricity Rates & energy Update September 2022
Winter weather is more weighted than normal this year because demand is outpacing growth in supply of natural gas and that is affecting power prices.
HISTORICALNEAR-TERM FORECAST
Natural gas production is up about 3.784% from 2021, but most of it was consumed by LNG (export) and electricity generation demand. Meanwhile, natural gas consumption is likely to be at its highest level on record and exceed 2019 levels, per the EIA. Consumption is projected to be up 4.337% from 2021 levels. As is often the case, the biggest factor affecting power energy and electricity prices will be winter weather.
U.S. natural gas consumption likely to increase in all sectors
We expect U.S. natural gas consumption in 2022 to increase by 3.6 billion cubic feet per day (Bcf/d) from 2021 levels to average 86.6 Bcf/d for the year, the highest annual natural gas consumption on record. It looks like U.S. natural gas consumption will increase in all sectors, led by the electric power sector and the residential and commercial sectors.
In the electric power sector, which consumes the most natural gas, annual consumption has increased by 1.2 Bcf/d in 2022 to average 32.1 Bcf/d, which is 0.3 Bcf/d greater than the previous annual record high of 31.8 Bcf/d set in 2020.
When we get our electric bills, we all know this sector is sensitive to changes in natural gas prices relative to coal prices. Many power providers typically offset their use of natural gas with coal for electricity generation when natural gas prices are relatively high.
Impact on Electricity Prices
Despite a large increase in natural gas prices this year, U.S. consumption of natural gas in the electric power sector increased in the first eight months of 2022, averaging 33.2 Bcf/d, which is 2.0 Bcf/d higher than the same time in 2021 and 0.4 Bcf/d higher than in 2020. Over the same eight-month period, the natural gas price at the U.S. benchmark Henry Hub in Louisiana averaged $6.56 per million British thermal units (MMBtu) in 2022, compared with $3.43/MMBtu in 2021 and $1.86/MMBtu in 2020.
U.S. consumption of natural gas in the electric power sector has increased in 2022 due to limitations at coal-fired power plants and weather-driven demand. Coal-fired power plants have been limited in their ability to increase power generation due to historically low on-site inventories, constraints in fuel delivery to coal plants, and continued coal capacity retirements. During both a cold January and a hot summer, natural gas was key to meeting electricity demand peaks throughout the country. We expect natural gas consumption in the electric power sector to decline in the fourth quarter of 2022 and in 2023, in part, due to more renewable electricity generation capacity coming online.
Residential Consumption of Gas / Electricity
We forecast annual U.S. consumption of natural gas in 2022 to have increase by 0.9 Bcf/d in the residential sector and by 0.7 Bcf/d in the commercial sector, driven by high consumption in January. January 2022 was particularly cold, resulting in 9% more heating degree days (HDD) compared with the previous 10-year (2012–2021) average. Natural gas consumption in these two sectors averaged 8% higher than the five-year (2017–2021) average in January, averaging 31.0 Bcf/d in the residential sector and 17.8 Bcf/d in the commercial sector. We expect natural gas consumption in the residential and commercial sectors in 2023 to be similar to 2022 levels.
Electricity to air-condition our homes has been expensive this summer. Unfortunately, it looks like it is not going to let up. Even turning up the heat this winter will cost more. It’s all being driven by the increase in the price of natural gas. In the U.S., we use it to generate approximately 40% of our electricity.
By now everyone knows that Russia’s disruption to the energy markets is the cause… Sure Russia’s own decision to shut off flow to Europe and the West’s sanctions/boycotts are screwing things up, but that gas is still getting to the global marketplace. So why are prices still high?
Russia has a massive geographic footprint and produces an outsized proportion (in relation to its population) of the world’s natural gas, so there seems to be less natural gas in the world lately. Is that true though?
The Reasons Why Natural Gas (And Electricity) is High
Russia’s invasion and continuing war with Ukraine has shifted the flow of supply to it’s dwindling number of “friendly” countries. Consequently, Russia is receive less money for its product while the countries are getting it cheaper for the the bulk natural gas. These “Russia-friendly” countries receiving the natural gas do not match the consumption of the west AND they know Russia is in a bind, so the marketplace is out of balance and fewer hands are on the commodity. So a new cartel of sorts is in charge of natural gas instead of just OPEC, and it seems that they are going to make the most money while they can. Plus the cost of moving it around the world will increase, so that’s why prices are are from an market perspetive.
Social / Cultural Impact on Electricity Prices
Another big reason why energy and electricity prices stay high is because our consumption has not dropped.
1) We’re facing higher temps and powerful weather. Given how hot this summer was for parts of the U.S., many had their air conditioners working overtime… this increases demand and there are more volatile spikes in demand 2) Lack of solidarity for Ukraine/Europe… we’re not decreasing our demand 3) There is a continued ambivalence to over-consumption… our demand is perpetually increasing (we waste energy and electricity producing food that goes to waste, creature comforts like cold restaurants set to 68F in Houston during the summer forcing many to bring wraps or jackets inside when it is 105F outside.
What’s Ahead for Electric Rates?
Forecasters predict these elevated gas prices to stay high through the rest of 2022 and through winter 2023. Russia has supplied Europe with cheap natural gas to power commercial and residential heat or electricity, so they know that they can continue to use its energy resources as a weapon and bargaining tool with the world.
In the U.S., half of homes use natural gas for heating or cooling. U.S. natural gas inventories have also dropped this year, which together has driven up prices around 300% from just a few years ago. What will this mean for energy and electricity prices in the U.S.?
Electricity Prices Will Keep Climbing
Even though our inventory LNG (liquid natural gas) is low, this hasn’t stopped the U.S. from exporting large amounts to Europe to help fill the void left by Russia. U.S. natural gas producers have an incentive to export since they stand to profit from the spike in global prices. It is as simple as that.
A simple reduction in demand/consumption/use would address that, but its diffusion of responsibility. Individuals don’t want to take ownership of the impact of their own choices to consume. If the price they can get in Europe is a lot more than what they can sell their natural gas for in the U.S., then some of that is going to be exported to Europe, and that is going to raise the price of things in the United States. It won’t be to the price levels seen in Europe, but we will likely continue to see more expensive energy costs in the U.S.
GET THE BEST ELECTRICTY FOR YOUR BUSINESS
We FORCE electricity companies to compete! Electricity providers will offer a lower price to us because they know they are competing for the business. This drives your price down!
Bills could go up a lot, especially in a state like Texas, which is the largest natural gas-consuming state. Forecasters estimate the average family will pay more than $1,200 to heat homes this winter, which is $175 more than last winter. That’s a 17% increase! And for the 40% of U.S. homes that use natural gas to heat/cool their homes, they could see up to a 33% increase.
What makes it even more impactful is that nearly 40% of families are already feeling financially strapped according to recent polls and reports.
How will high natural gas and electricity prices last?
Given the trends in weather patterns, the northern hemisphere could be spared the spike in natural gas prices is the winter is mild… again.
Even so, it really depends on Russia and Putin’s choices. Kremlin spokesman Dmitry Peskov said this month that Russia will resume gas flows only if the West lifts sanctions.
The other big factor is how quickly Europe can find alternative natural gas sources. Europe gets most of its gas through pipelines, but the EU is working build new infrastructure to receive liquefied natural gas, which can be transported by sea from other producers like Qatar & U.S.
That takes time, so price relief is not expected any time soon.
Everyone in Texas is being confronted with the reality of high and escalating energy bills (gas and electricity). Many commercial and residential customers are paying at least 50% more than they did for electric bills at this time last year.
Meanwhile, the state is exporting more natural gas than it has ever before. And since the cost of electricity in Texas is tightly tied directly to the price of natural gas, many business owner’s electricity bills are through the roof with no end to the escalation in site. The concern is that many people are going to be shocked when their bills start coming in 30-60 days from now.
So what is spushing gas and electric bills up so high? Texas power plants run on natural gas.
It’s mainly the price of natural gas… it has rocketed up more than 200% since late February when Russia, a top gas-producing country, invaded Ukraine and upended the world’s energy market. Since then, Texas, the leading natural gas-producing state in the U.S., has not been able to ramp up production enough to keep offering residents cheap electricity.
Since the war in Ukraine began, Texas has been sending most of the natural gas or LNG (liquified natural gas) to Europe as many countries boycott Russian gas, oil, and energy. Europe is fortunate that the U.S. Congress lifted the ban on oil and gas exports back in 2015. Now countries are qeueing up purchase Texas’ gas. At the same time, demand for natural gas has also been growing within the state because business in Texas hsa been booming attracting more residents. Furthermore, a super-hot spring and early summer also have driven power-usage to record-high levels.
GET THE BEST ELECTRICTY FOR YOUR BUSINESS
We FORCE electricity companies to compete! Electricity providers will offer a lower price to us because they know they are competing for the business. This drives your price down!
With the war in Ukraine dragging on and upending the world energy market, Texas electricity providers are cautioning customers that the high rates will likely linger for months. Like the rest of the country, the hike in utility bills comes during difficult financial times for people facing high prices at grocery stores and the fuel pump due to inflation.
On the other side of the coin, the high prices will benefit Texas’ gas producer, and the state benefits from high oil and gas prices in the form of jobs and state taxes on oil and gas production. Cities located in the state’s oil fields usually benefit even more.
No Growth in Energy Production
Even though demand is going up, the oil and gas industry isn’t seeing major production growth because of a backlog of equipment needed. That supply chain issue stems from the pandemic. Though companies are trying to hire, there’s also a shortage of labor across most of the oilfield services. It has been a struggle to get qualified people into the positions that big oil and gas need right now.
Is the price of natural gas the only cause of high electricity prices?
The state’s main power grid operator, the Electric Reliability Council of Texas, has been managing the grid more cautiously and is no longer prioritizing providing Texans cheap power. ERCOT’s prmary focus these days is the grid’s reliability, especially during extreme weather. That means power plants that produce electcity are being asked to stay online and available just in case. Consequently, the state is paying generators a pre-set price to operate no matter what happens. This is quite wasteful… the need for “security” or continuity of power is driving up electricity rates. Before the power grid calamity in 2021, electrciity producers ramped up or went offline based on market demand.
Due to poor administration, Texans are paying for last year’s grid disaster… and will for years.